How To Track Website Performance With Actionable KPIs

It’s almost impossible to sustainably keep an eye on all the metrics that track website performance.
That’s why we’ve narrowed it down for you. Use this list to start making informed and insightful actions to boost the success of your website.
Acquisition KPIs
Acquisition metrics help you find out who your visitors are and where they came from. They show how effective your marketing efforts and website content is at imploring people to visit.
Traffic sources
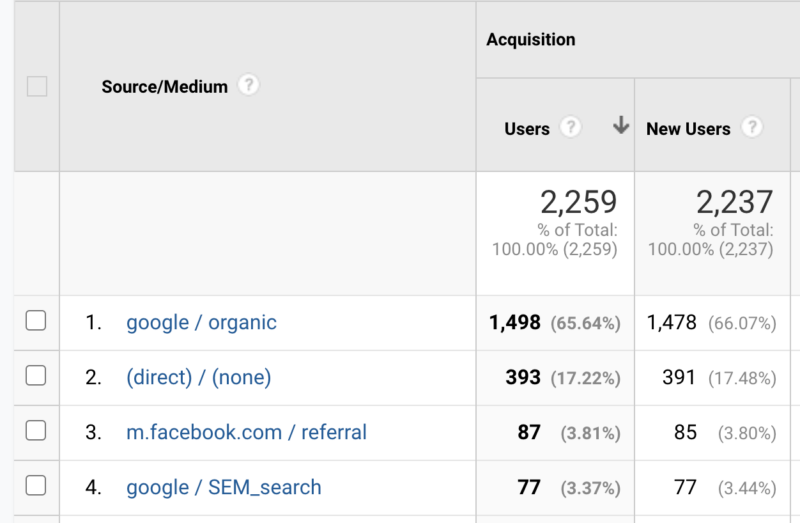
Most businesses use multiple channels to attract visitors. The source/medium filter in Google Analytics will show you which marketing methods are working. Understanding where traffic comes from helps identify the efficacy of your marketing campaigns.
In the example below, you can see that Google has been the top source of traffic and the channel that has sourced the most traffic is organic. The worst performing source of the same period is also Google but this time the channel is SEM paid search (which is more commonly known as Google Ads). This would indicate the SEM paid search campaigns need looking at.

Unique visitors
The unique users metric gives you an idea of the size of your audience. The more unique visitors you have, the bigger your audience is which is good. It shows how many individuals are interested in your business. It’s a good idea to try to increase this number by using marketing campaigns and adding new content.
Digging a little deeper, it also helps to determine who you should focus on. Identifying visitors returning to your website helps you find warmer leads. Returning website visitors are more engaged than first-time visitors.
New vs returning visitors
The proportion of new visitors to returning visitors is vital for understanding your retention rates. This metric indicates how capable your website content is at creating long-term interest.
The acquisition of new users is important for boosting sales. The bigger the number, the more potential customers you have. At the same time, your returning visitors are the ones who are most engaged, and therefore more likely to convert so it’s really important to monitor both and target both separately.
Organic traffic
Tracking organic traffic is important for SEO. Most other metrics and actions are designed to grow the number of people visiting your website organically. If you aren’t getting much organic traffic, you may need to take a closer look at your content and SEO strategy.
Your organic traffic shows how many people are finding your website just by searching the internet. It is a really good indicator as to whether your marketing is working. However, if your traffic is high and conversions are low, it may be worth looking into the search terms people are using to find your website. That way you can adjust your content so it contains more relevant keywords and attracts the right audience.
You can find out what people are searching for using Google Search Console.
Engagement KPIs
Engagement metrics track how effective your website is at keeping visitors and converting them into customers. These metrics tell you how effective your website is at encouraging users to interact with your content.
Bounce rate
Bounce rate can help inform your content strategy. The bounce rate is the percentage of single-page sessions where a user did not interact with your website. A high bounce rate can mean a few things:
- The website does not contain valuable information for the customer
- The customer cannot find what they are looking for
- The page is badly designed affecting user experience
- The offer isn’t lucrative enough or offer enough value
It’s important to pay attention to bounce rate and which pages have the highest bounce rate so you can craft relevant content that’s engaging to your target audience.
Average session duration
This metric shows how long people spend on your website in a single session. It’s also a great indication of how valuable users think your content is. Longer sessions usually mean that your visitors are engaged.
Don’t worry if the session duration is low on your landing pages – this can be good if you are receiving enquiries or sales. It shows that the content is straight to the point and exactly what the visitor is looking for.
But, if the average session duration is low and the bounce rate is high, you’re most likely not producing the right content for the searcher’s intent.
Pages viewed per session
The number of pages per session tells you if your landing pages contain valuable and engaging information. Higher pages per session show that the user finds your content interesting, and they trust the following pages to also hold value.
If the number of pages viewed per session is low but your website conversion rate is high, this is a positive sign that your website contains the right information for the customer and your marketing efforts are working.
Page loading time
Page loading time is how long it takes for your website to load its content. It’s important to keep an eye on this. Users will leave your website, increasing bounce rate and costing you conversions if your website has a slow loading time.
Many factors affect the page load time including but not limited to:
- The hosting server
- The page design
- Image sizes
- Design of the page
- The number of elements on the page
- User location
- Browser type
If you want to find out how your website is currently performing, we offer a free manual website review which you can request here.
Conversion KPI’s
Conversion KPIs measure how effective your website is at driving business and revenue.
Number of conversions
This website KPI is usually the number of leads or sales your website generates. It reflects the number of users interested in your offering. Conversions differ from business to business. You may wish to track subscriptions to newsletters, product orders and sales or form submissions depending on your business type.
Conversion rate
This is the ratio between the number of website visitors and the number of purchases or leads. A low conversion rate can have a few causes such as low traffic, irrelevant traffic, poor quality content or unclear call-to-actions.
Each circumstance we’ve mentioned requires a different approach to rectify, that’s why it’s important to keep track of the right KPIs.
Overall sales value and cost per conversion
When it comes to tracking the ROI of your marketing spend, the overall sales value of your conversions is the best way to measure effectiveness. Having a good number of sales may seem great, but not if your promotional spending is higher than your revenues.
Example (these examples use lower numbers for ease of calculations)
- Bakery X spends £1,000 on a Google Ads campaign and receives 20 new orders. The cost per conversion averages at £50. Each order is for a wedding cake which is each valued at £250. This means Bakery X generated £5,000 in revenue from £1,000 spend.
- Bakery Y also spends £1,000 on a Google Ads campaign and receives 20 new orders. The cost per conversion is £50. Each order is for trays of cupcakes which are each valued at £25. This means Bakery Y spent £1,000 to generate £500 worth of orders leaving the bakery out of pocket.
Goals and event completion
In Google Analytics you can track metrics specific to your business by setting up individual goals. Generally, goal completions have the most tangible ROI.
Each business will have a different metric they should be measuring. For example, if you’re a local DIY store that doesn’t sell online, you might want to track how many people click to call or ask for directions. If you’re a service-based business, like a sports therapist, you may want to measure how many visitors schedule an appointment. If you’re a marketing agency, you may want to track how many people sign up for a newsletter or complete an enquiry form.
Conclusion
Once you have Google Analytics set up and the tracking code installed on your website, all these KPIs will be available to you. But you will need to set up your goal tracking and conversion tracking manually. A good idea would be to add “website enquiries” to your CRM or accounts software as trackers so you can use real revenue data. Without setting this up, you won’t know if your website is performing well or not. Implementing this would give you certainty and actionable insights rather than an assumption.
You can use these metrics to start to track website performance to determine the actions which will drive toward your business goals. We also offer a free website review and provide a report with tailored recommendations.
To see how your website stacks up, request a free website review.
